Outsourced IT monitoring means entrusting an external team with watching over your applications and infrastructure: collecting metrics, logs and traces, handling alerts, first diagnosis, fixing or escalating, and continuous improvement. It delivers the most when that team knows the applications it monitors, and when the rules are written down: what is monitored, during which hours, with what response times and who decides. Here is how to organize it, and what we do at Etixio.

What monitoring means in 2026
Monitoring is no longer just checking that a server responds. On today’s architectures (cloud, containers, managed services, third-party APIs, AI services), we talk about observability: the ability to understand what is happening in the system from three types of signals.
- Metrics: response times, error rates, throughput, resource saturation.
- Logs: what the application and infrastructure write, centralized and searchable.
- Traces: the path of a request across services, to find where it slows down or fails.
OpenTelemetry has become the open standard for collecting these signals. For tools, common choices are Prometheus and Grafana, Zabbix or Centreon for traditional infrastructure, or commercial platforms such as Datadog. The right tool is often the one you already have, properly tuned.
Monitor what matters to your users
The most common mistake is to monitor lots of things and get alerted too often. Useful monitoring starts from business journeys:
- Critical journeys: login, ordering, payment, filing a case, exports. Are they available and fast?
- Service indicators: error rate, 95th percentile response time, pending queues, scheduled jobs that actually ran.
- Deadlines: certificates, domain names, licenses, API quotas.
- Resources: CPU, memory, disk, database connections.
- Backups: run, complete, and restored at least once to prove they work.
- Cloud costs and, for AI services, consumption and answer quality (see LLMOps and AI evaluation).
Every alert should call for an action. If nobody knows what to do when it fires, it should be removed or paired with a procedure. Here is a Prometheus alert rule linked to a written runbook:
groups:
  - name: api
    rules:
      - alert: HighApiErrorRate
        expr: |
          sum(rate(http_requests_total{job="api", status=~"5.."}[5m]))
            / sum(rate(http_requests_total{job="api"}[5m])) > 0.05
        for: 10m
        labels:
          severity: critical
        annotations:
          summary: "More than 5% server errors on the API for 10 minutes"
          runbook_url: https://wiki.example.com/runbooks/api-errors
What you can hand over, what you keep
Hand over: setting up and tuning the tools, daily alert handling, first diagnosis, fixes on the applications the provider maintains, scheduled updates and security patches, reports and trend analysis.
Keep: priorities, trade-offs between risk and cost, approval of sensitive changes, relationships with your users and vendors, and ownership of everything that has been set up.
Ownership is key. Tools, dashboards, alert rules, runbooks and incident history should live in your accounts and your repositories. If you change providers, you take everything back.
Define service levels
A serious monitoring contract answers a few questions in writing:
- Which hours are covered? Business hours, extended hours, evening or weekend on-call: each option has a different organization and cost.
- What response times? Time to acknowledge and resolution target, by severity level.
- What escalation? Who is notified, through which channel (email, Teams, Slack, phone), and who decides on a rollback.
- What reliability objectives? For critical services, explicit objectives (availability, response time) measured over time, rather than a general promise.
- What reporting? Regular reports, incident reviews, agreed actions.
Be wary of promises of “near-total” availability or quantified savings made before anyone has looked at your systems. A service level is built from your existing setup, how critical each application is, and what the team can actually sustain.
Monitoring and security
Monitoring contributes to security: it spots abnormal behavior, spikes in authentication errors, resources consumed for no reason. It does not replace a security operations center (SOC), which requires specific tools and skills. We recommend connecting the two: security alerts from monitoring feed your security setup, and patches are applied within defined timeframes. These topics fit into a cybersecurity and compliance program.
How we work at Etixio
At Etixio, monitoring is part of our DevOps & Cloud Management offer. It primarily covers the applications we build or maintain for you, and the infrastructure that runs them. If you wish, we handle day-to-day operations: monitoring, fixes, updates and continuous improvement, with a support level, hours and response times defined together.
In practice:
- Assessment: applications, environments, existing tools, recent incidents, risks. This is often the subject of a technical audit.
- Setup: collection of metrics, logs and traces, dashboards, alerts linked to runbooks, in your cloud accounts and your tools.
- Operations: alert handling, diagnosis, fixing or escalating according to the agreed rules, a post-mortem after each significant incident.
- Continuous improvement: tuning thresholds, removing useless alerts, automating recurring fixes, regular reviews with your teams.
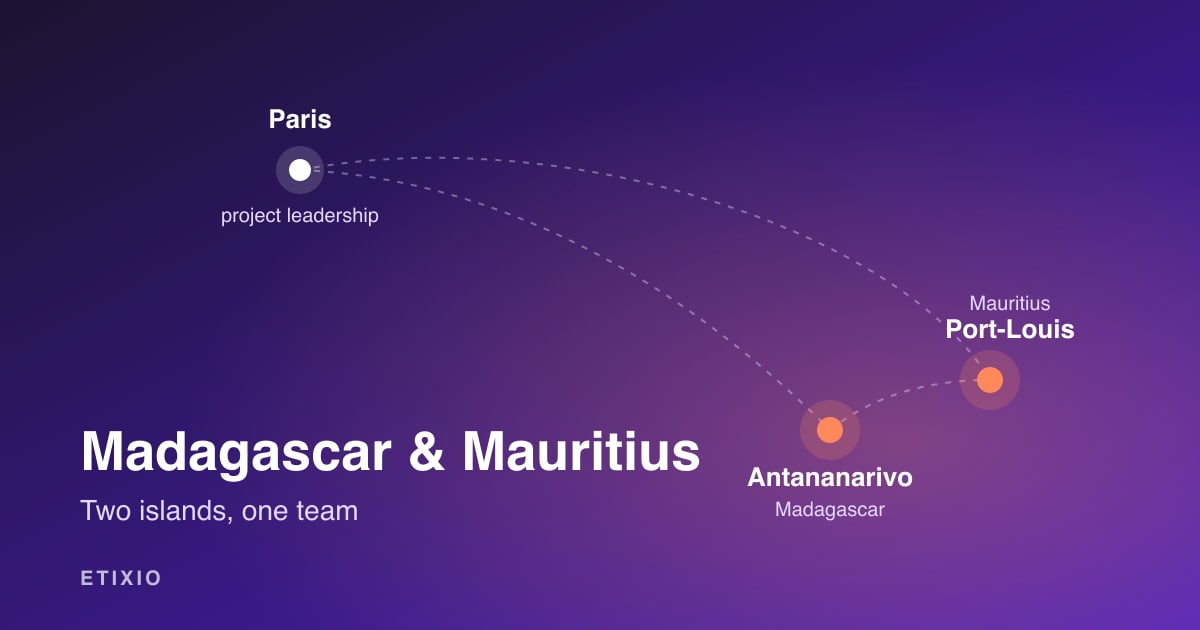
The work is carried out by our engineering teams in Madagascar and Mauritius, managed from France, with an Etixio tech lead accountable for quality and continuity: up-to-date documentation, written procedures, organized handover. Madagascar is at UTC+3 and Mauritius at UTC+4: our teams start their day one to three hours before Paris, which makes it possible to handle overnight alerts and run first diagnoses before your teams arrive. Any coverage beyond working hours is explicitly defined in the contract.
Your code, your access, your tools: everything stays yours. Our teams work in your environment, with your rules, and you can take back control at any time.
Want to make an application’s operations more reliable or organize its monitoring? Tell us about your environment: we will start with an assessment.
FAQ
Why outsource IT monitoring?
To get operations skills (monitoring tools, alerting, diagnosis) without building them entirely in-house, and to have your applications monitored by people who know them. The benefit is greatest when the provider already builds or maintains those applications: they know what to watch and how to fix it.
What should you monitor first?
What your users experience before the state of the machines: availability and response time of critical user journeys, error rates, processing queues, scheduled jobs, certificates and deadlines. Then come resources (CPU, memory, disk, database), backups and cloud costs.
What service level should you plan for?
It depends on how critical each service is: hours covered, response and resolution times by severity level, escalation path, possible on-call. At Etixio, the support level, hours and response times are defined together and written into the contract; we don’t promise coverage we haven’t organized.
Does outsourcing IT monitoring mean losing control of your systems?
No, if governance is clear. Tools, dashboards, access and incident history stay with you; you set priorities and approve changes. The provider works in your environment, with your rules, and reports to you regularly. See our article on offshore IT team governance.
How much does outsourced IT monitoring cost?
The cost depends on the scope (number of applications and environments), the hours covered, the expected response times and the tools already in place. We price it after reviewing your current setup, rather than with a generic rate.
Why do teams in Madagascar and Mauritius help with monitoring?
Our teams there work in French and English, at UTC+3 (Madagascar) and UTC+4 (Mauritius), 1 to 3 hours ahead of Paris depending on the season. Their day starts before yours: morning checks, handling of overnight alerts and first diagnoses can be done by the time your teams arrive. For extended coverage, hours are defined in the contract.